跟著我們

Electricity Maps

5.0
5.0 顆星,最多 5 顆星(基於 1 則評論)
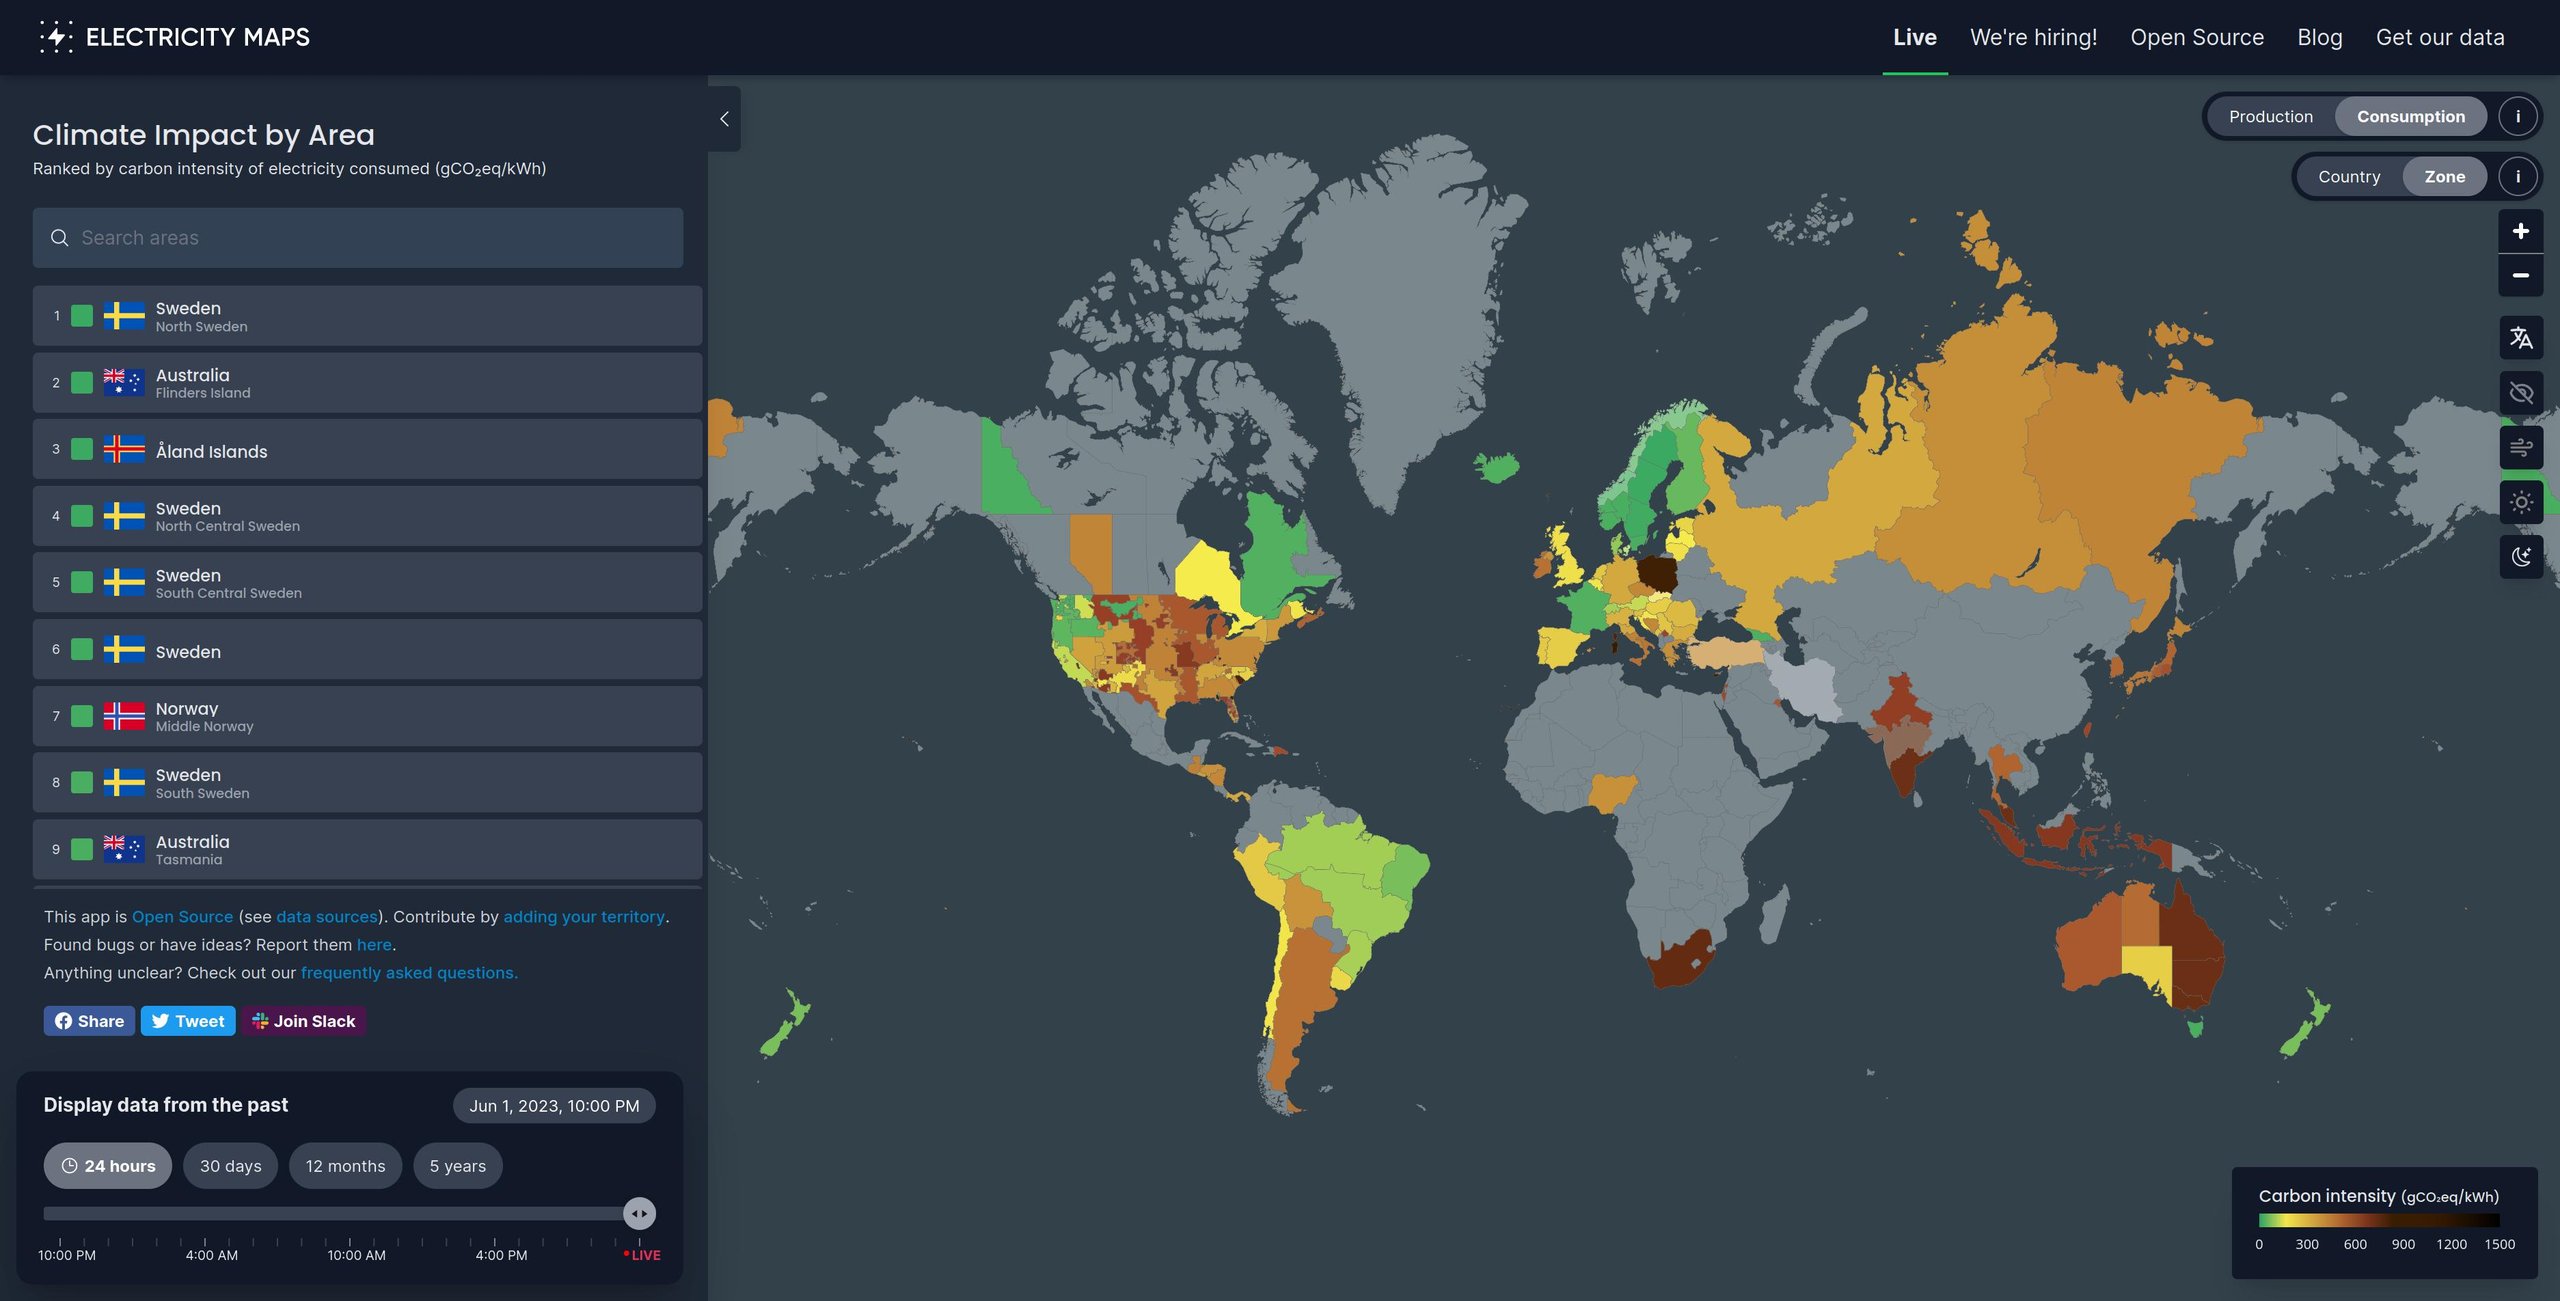
出色的100%
非常好0%
平均0%
較差的0%
糟糕的0%
官方網站 ”
關於:

This project aims to provide a free, open-source, and transparent visualisation of the carbon intensity of electricity consumption around the world. We fetch the raw production data from public, free, and official sources. They include official government and transmission system operators’ data. We then run our flow-tracing algorithm to calculate the actual carbon intensity of a country’s electricity consumption.

提供:
03/06/2023

There’s a usage tracker on the website, but according to their website they do that by not collecting “personal data or personally identifiable information (PII), without using cookies and while respecting the privacy of your website visitors.” (https://plausible.io/privacy-focused-web-analytics).

發表評論

您的電子郵件地址不會被公開。 必需的地方已做標記 *