フォローする

energy-charts.info

5.0
定格 5.0 から 5
5つ星のうち5.0 (1 件のレビューに基づく)
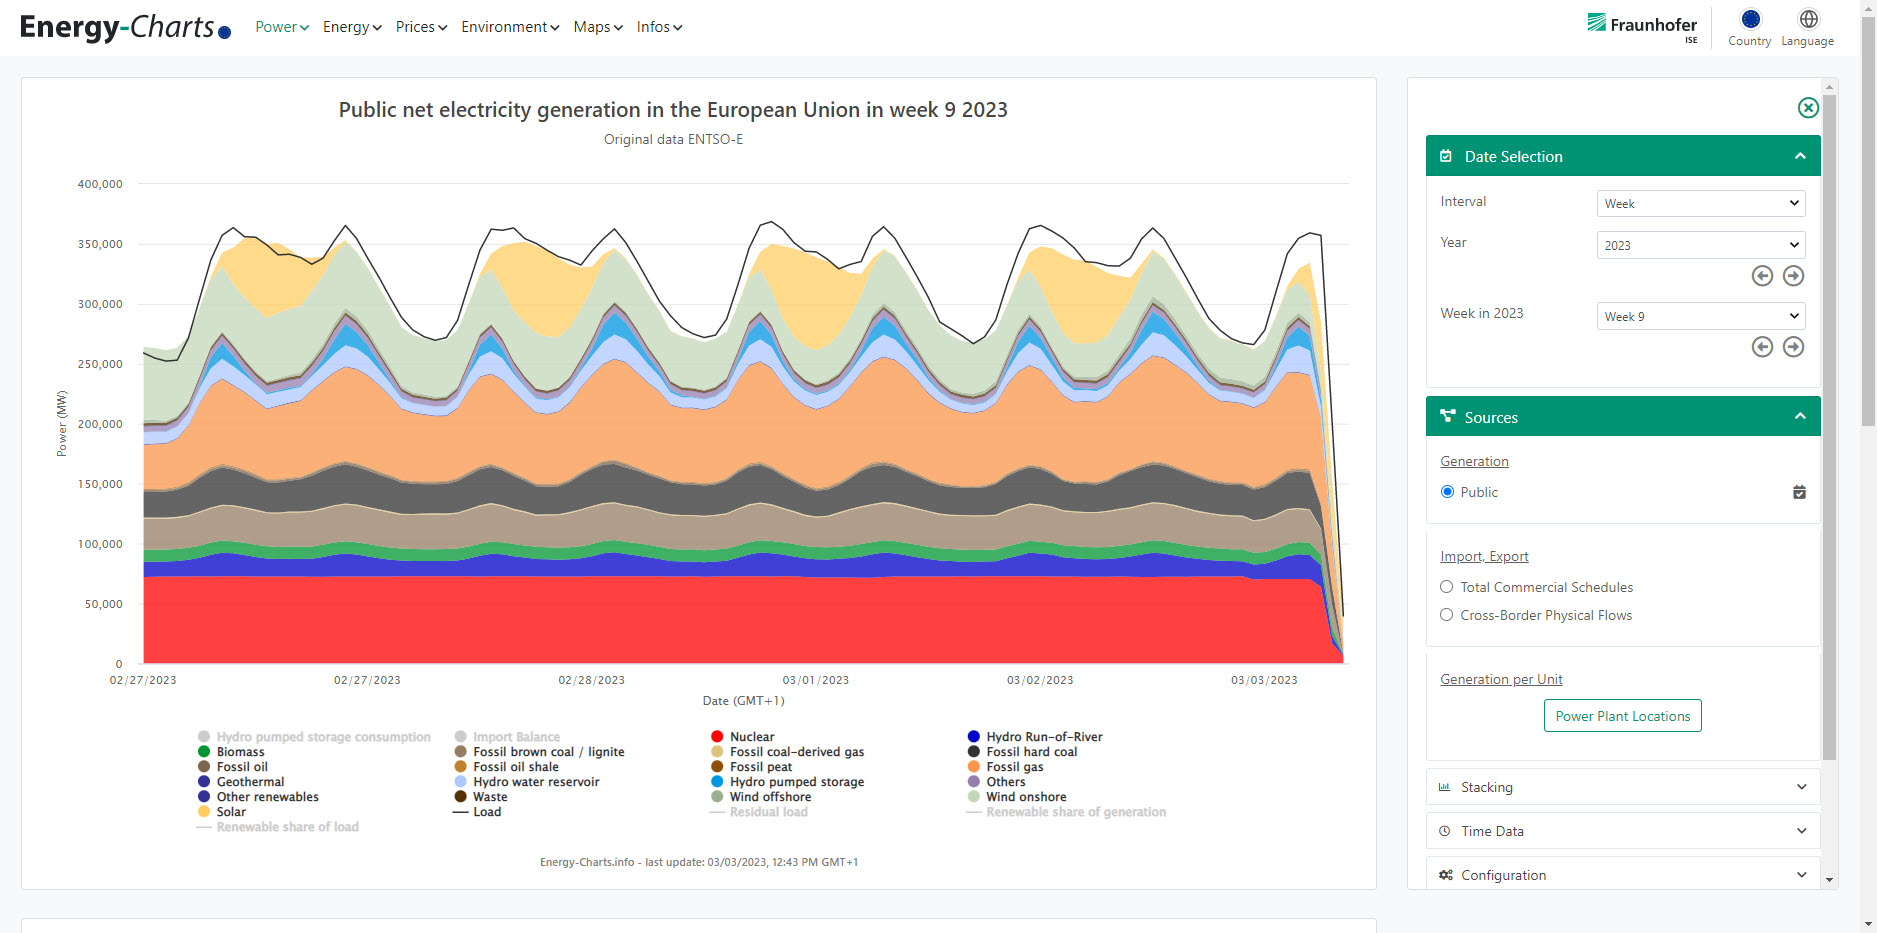
優れた100%
とても良い0%
平均0%
悪い0%
ひどい0%
公式サイト
about

The site for interactive graphics displaying energy production and spot market prices By making the data available on this website, it is our intent to promote transparent and objective discussions relating to all factors regarding the energy transformation.

提供:
定格 5.0 から 5
02023 年 6 月 3 日

There seems to be no advertising and data is collected from stats.ise.fraunhofer.de. These are probably for not-for-profit purposes and are processed according to GDPR principles. More info can be found in the privacy policy: https://www.energy-charts.info/data-protection.html?l=en&c=EU

返信を残す

あなたのメールアドレスが公開されることはありません。 必須フィールドは、マークされています *