フォローする

電力マップ

5.0
定格 5.0 から 5
5つ星のうち5.0 (1 件のレビューに基づく)
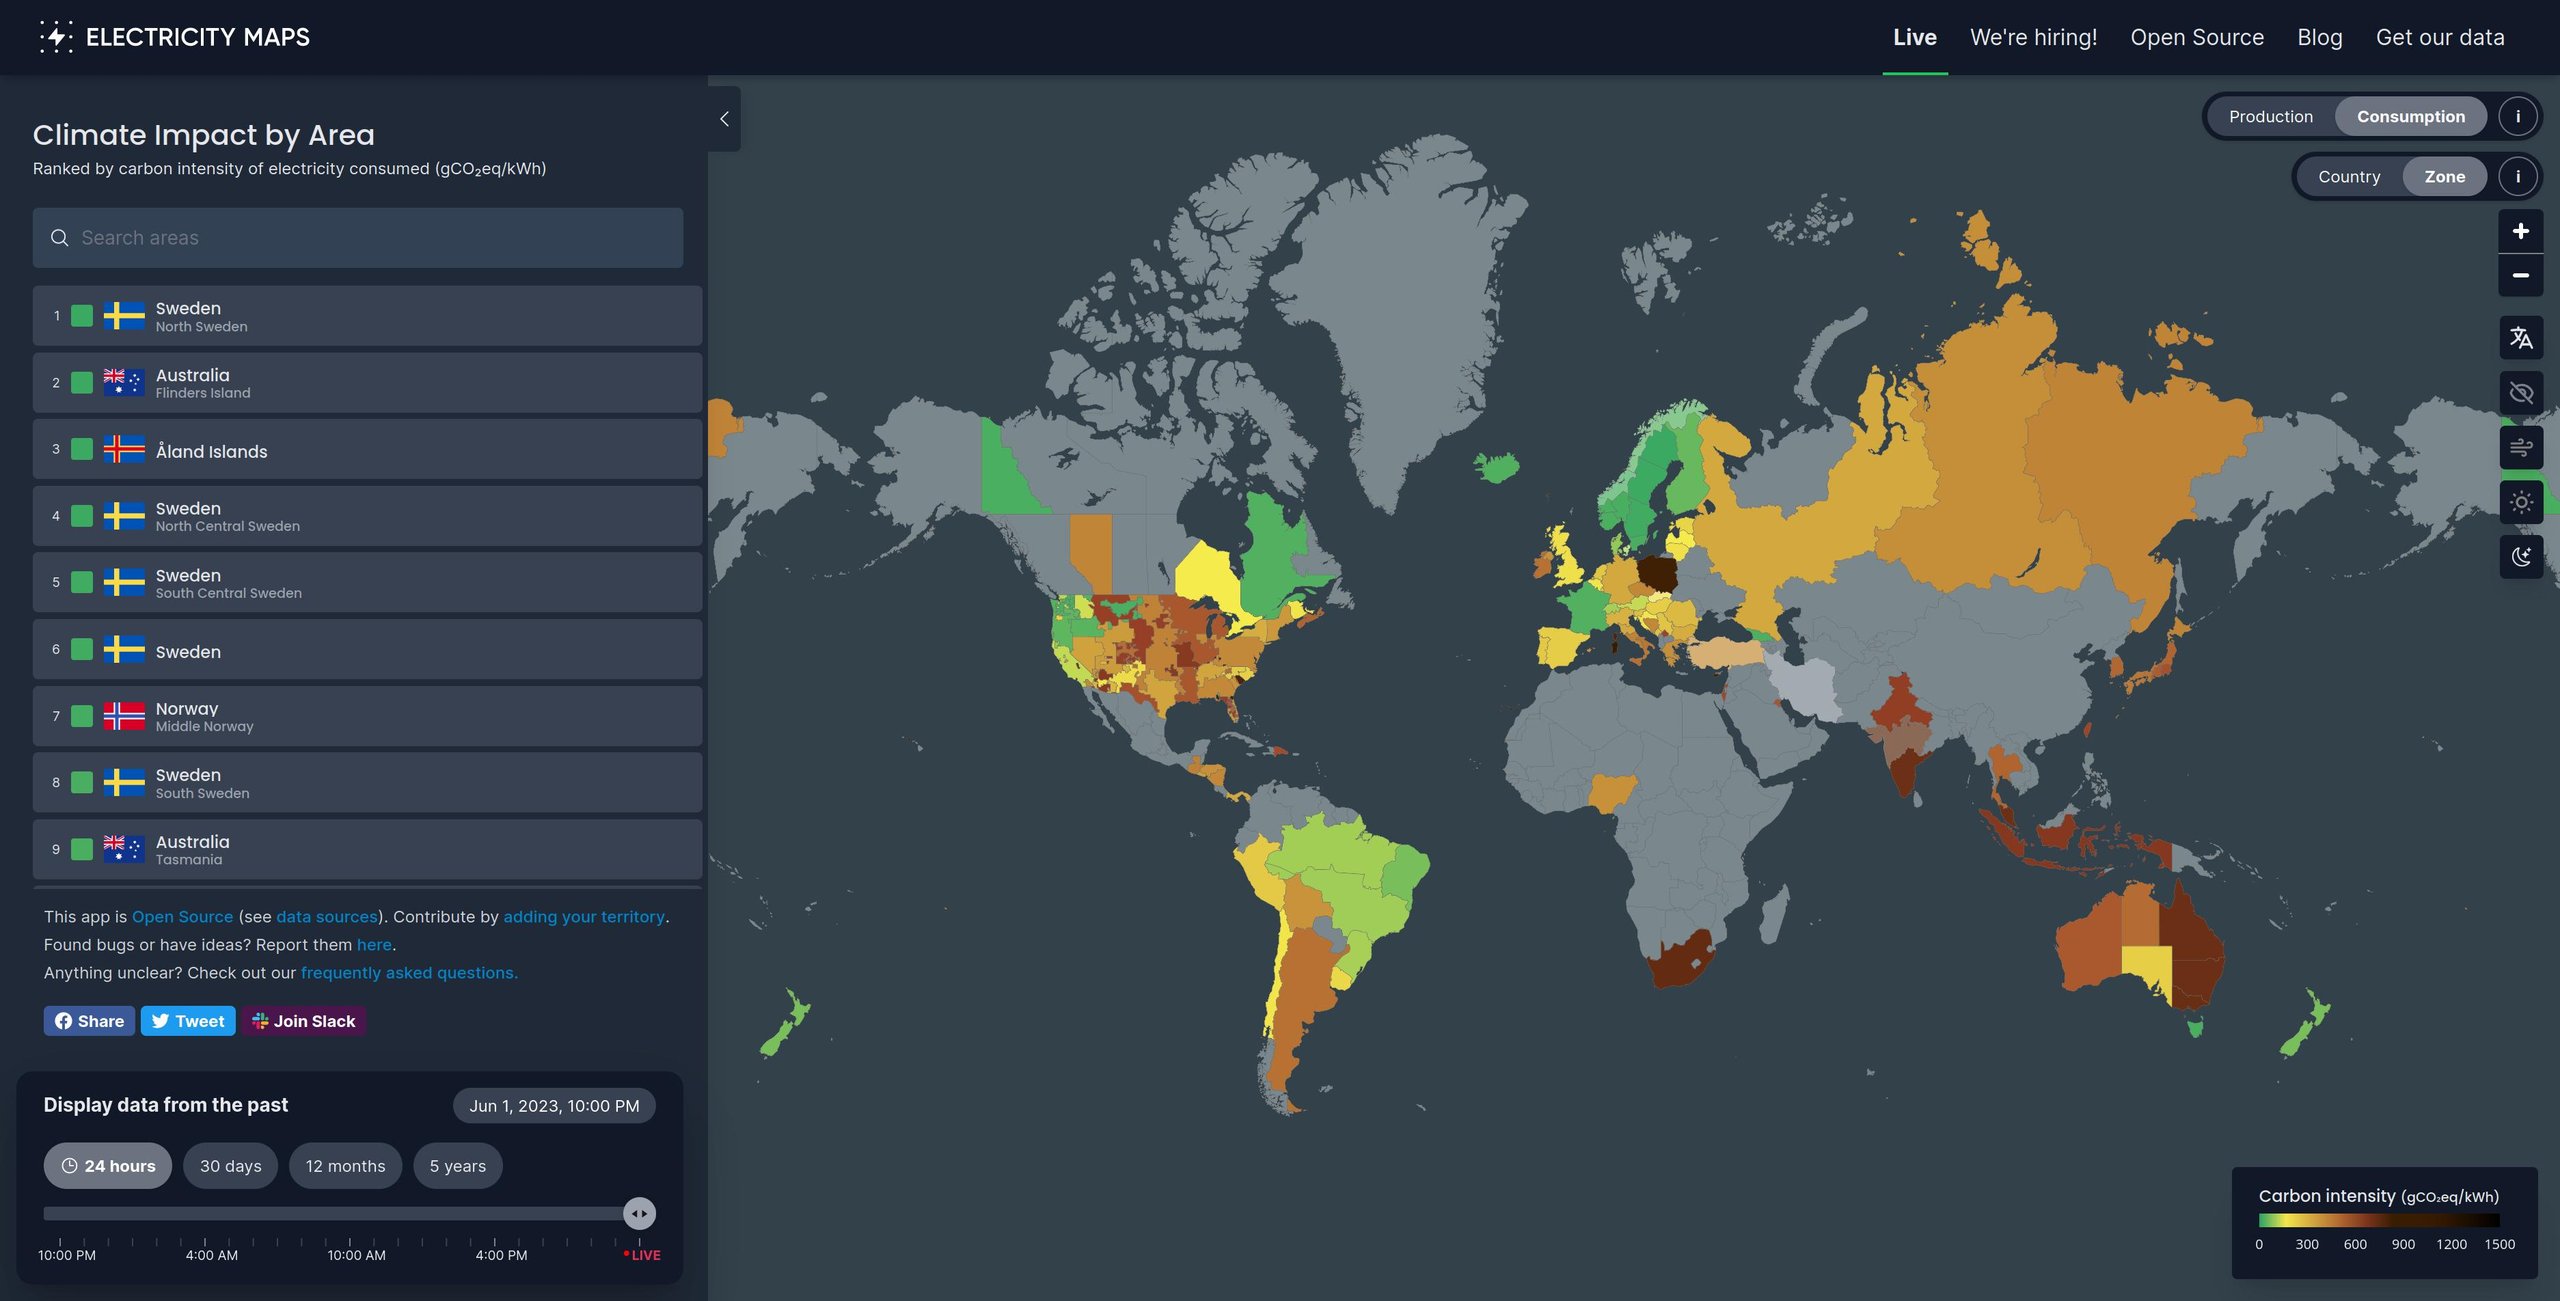
優れた100%
とても良い0%
平均0%
悪い0%
ひどい0%
公式サイト
about

This project aims to provide a free, open-source, and transparent visualisation of the carbon intensity of electricity consumption around the world. We fetch the raw production data from public, free, and official sources. They include official government and transmission system operators’ data. We then run our flow-tracing algorithm to calculate the actual carbon intensity of a country’s electricity consumption.

提供:
定格 5.0 から 5
02023/06/03

Web サイトには使用状況追跡機能がありますが、Web サイトによると、「Cookie を使用せず、Web サイト訪問者のプライバシーを尊重しながら、個人データや個人を特定できる情報 (PII)」を収集しないことによってそれを行っています。 (https://plausible.io/privacy-focused-web-analytics)。

返信を残す

あなたのメールアドレスが公開されることはありません。 必須フィールドは、マークされています *